About PathwAX
PathwAX, Pathway Analysis with crosstalk, is a webservice for pathway annotation based on crosstalk derived through FunCoup, a framework for genome wide functional association networks.g A pathway is tatistically enriched/depleted if the crosstalk, which is the number of links between the pathway and your gene set, is more/less than one would observe in a random network.This enables the possibility to see the gene sets in a bigger context allowing for more evidence to compute enriched pathway terms.
Ogris C., Helleday T., Sonnhammer E.L.L.. PathwAX: a web server for network crosstalk based pathway annotation. Nucleic Acids Res. 2016;44:W105−W109.
https://www.ncbi.nlm.nih.gov/pubmed/27151197
BinoX:
Ogris, C., Guala, D., Helleday, T. and Sonnhammer, E.L., 2017. A novel method for crosstalk analysis of biological networks: improving accuracy of pathway annotation. Nucleic acids research, 45(2), pp.e8-e8.
https://www.ncbi.nlm.nih.gov/pubmed/27664219
-
How To
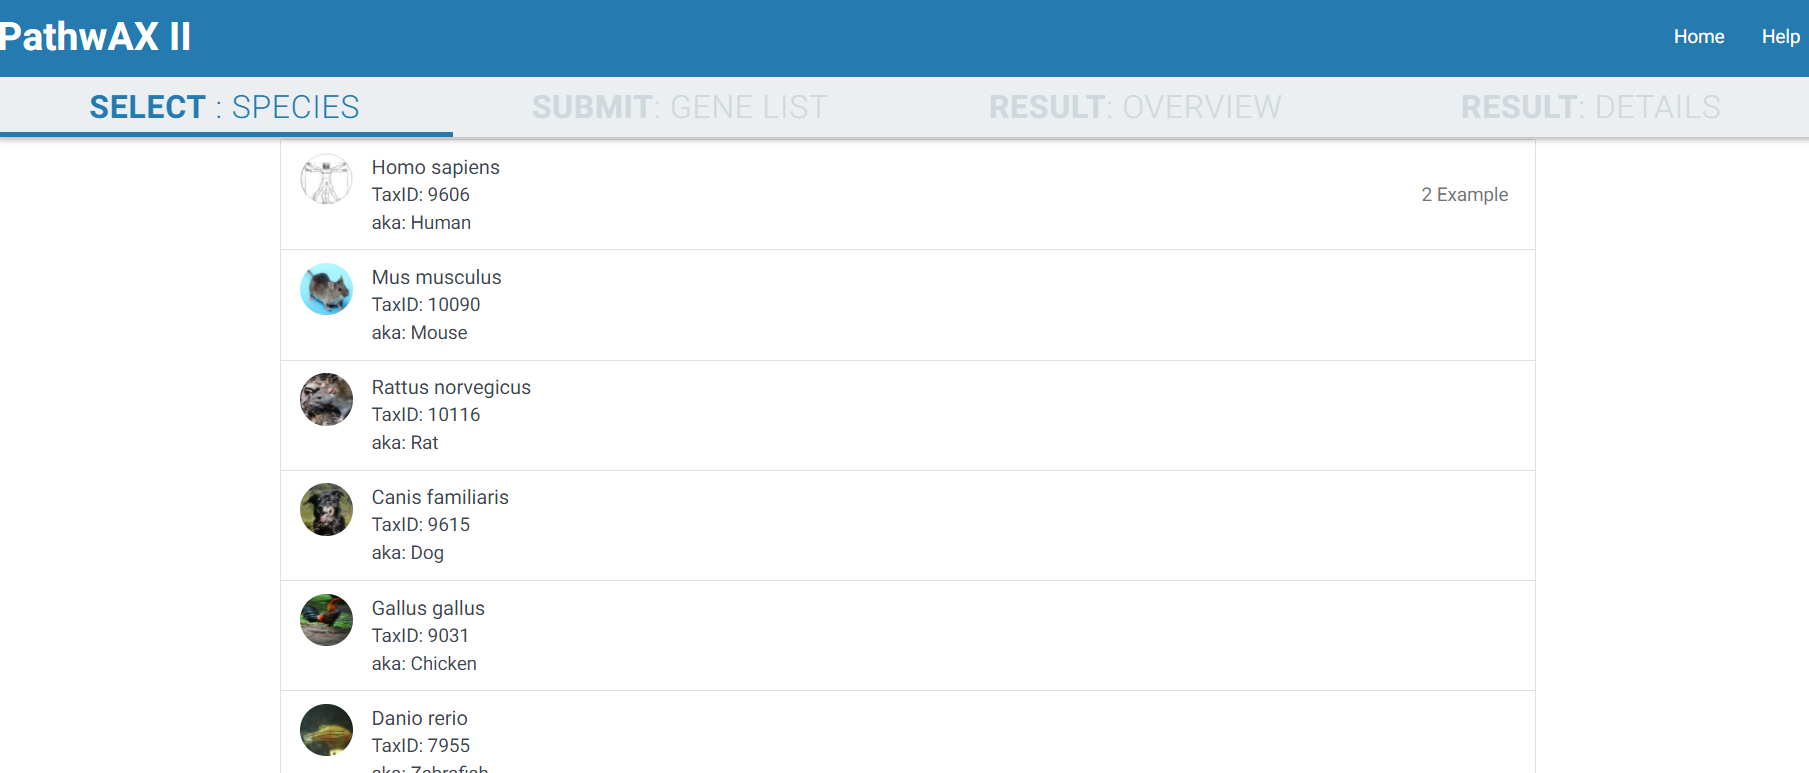
1) SELECT: SPECIES
2) SUBMIT: GENE LIST
The query searches for exact matches of symbols or identifiers and supports a variety of different identifier types including Ensembl, gene symbol IDs, NCBI/EntrezGene IDs, FlyBase IDs, WormBase IDs, PomBase IDs, ZFIN IDs or TairLocusAccession. For a search with multiple genes the identifiers should be separated by spaces or commas. Select which pathway database you want to use to run your analysis (KEGG or Reactome). The search and computation may take some 1-5 min depending on the query gene set.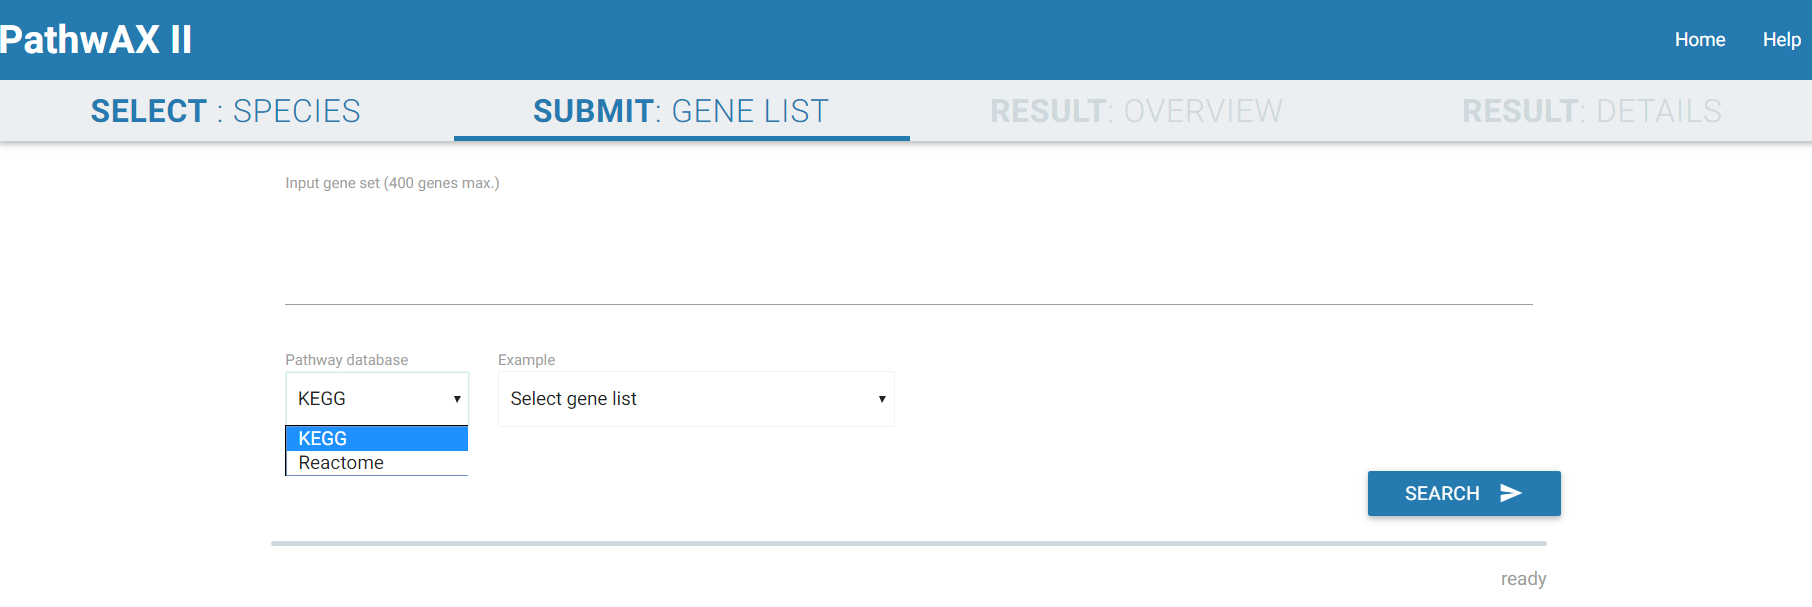
This part is computationaly heavy and depends on your browser. Best performance can be achieved using Chrome
3) RESULT: OVERVIEW
The result overview will give you an overview of significant related pathways. You can filter them by class or top hits. Moreover, you can also select the significant pathways that are only enriched, depleted or that they have an overlap with the gene list you submitted. The pathway class table provides a hint of which classes are most common in the results. A second table will visualize all hits. The pathway names are linked to the entry of the pathway database you selected in the previous step (KEGG or Reactome). A red name indicates depletion whereas a blue one indicates enrichment. Furthermore you can choose which multiple testing correction you want to perform, Bonferroni, Benjamini-Hochberg or none, as well as the cut off. The corrected p-value will show up in column 3. The last column illustrates each query gene as a box and its connectivity. Dark boxes indicate the gene to be a hub with multiple connections to a pathway. In addition, if the gene is present in the pathway it will be colored in purple. If you click on a pathway you are interested in it will redirect you to RESULT: DETAILS.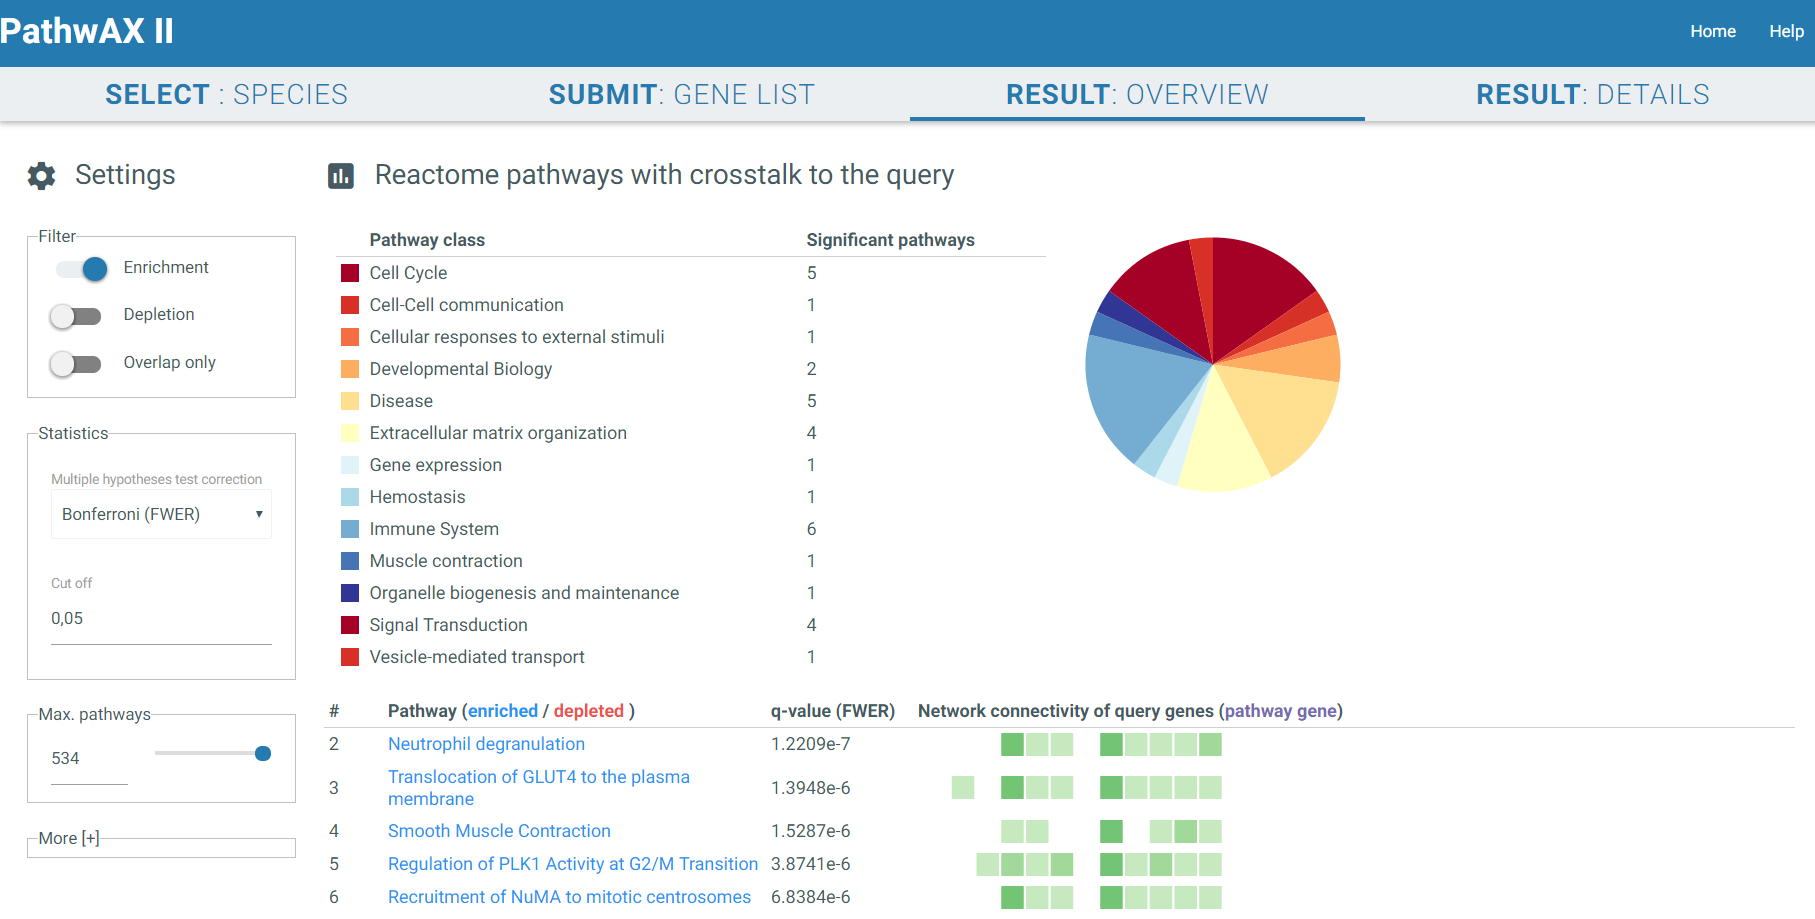
4) RESULT: DETAILS
The result details will give you a crosstalk viewer to get detailed insights of specific pathway-query relations. The genes are represented as nodes and their sizes depend on their degree. Gene label are by default Uniprot IDs but you can change them, depending on the species, to Ensembl IDs, gene symbol IDs, NCBI/EntrezGene IDs, FlyBase IDs, WormBase IDs, PomBase IDs, ZFIN IDs, TairLocusAccession, node degree or none. The color indicates if a node belongs to the pathway set (orange) or query set (green), or if it is a shared node (purple) present in both sets. Moving the mouse to the gene of interest will give you all its connections, hiding all unconnected nodes. The network can be zoom-in or zoom-out with the mouse wheel.
It will display the main statistical facts of the analysis in the Analysis panel. Additional information can be displayed by expanding the panel More.
You can select the graph style you want to display, force field or gridview. If the graph contains more than 1000 links it will only be displayed in gridview. Gridview will display the query nodes first, followed by shared and pathway nodes. The order of the nodes within the group depends on their link degree. The graph can be saved in csv format.
Force field viewer display: 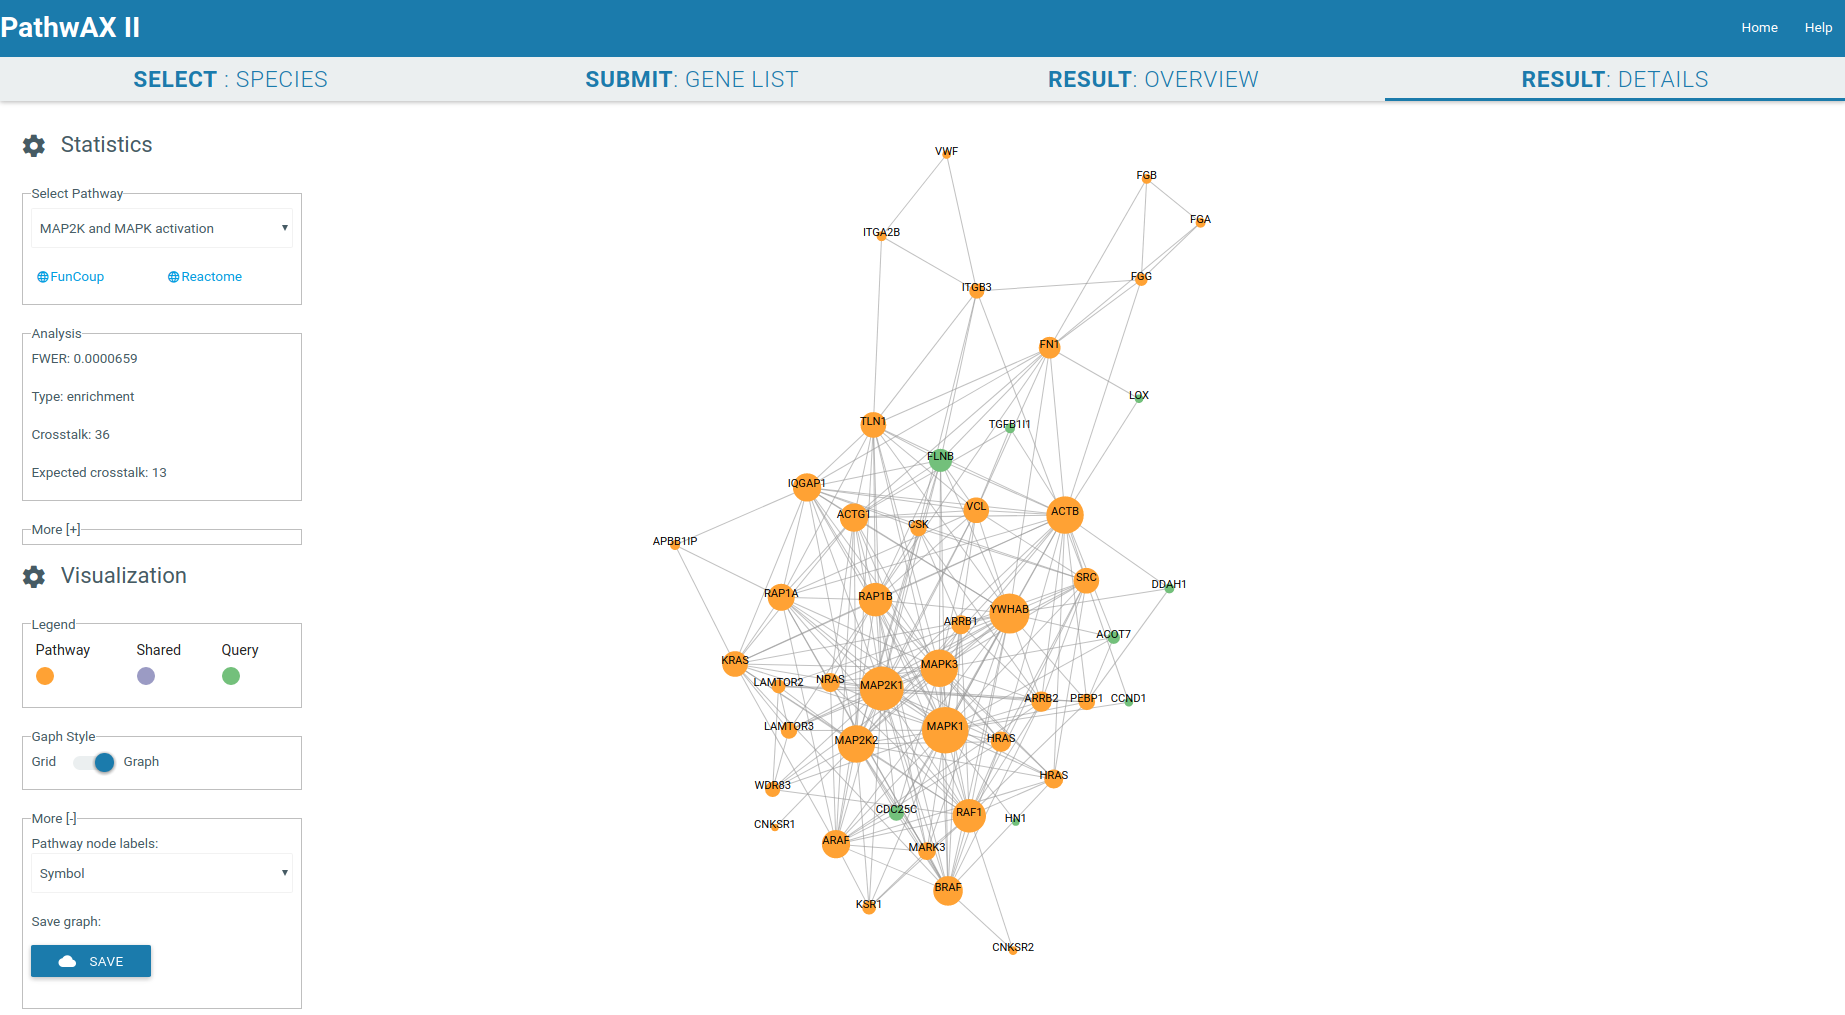
Grid viewer display: 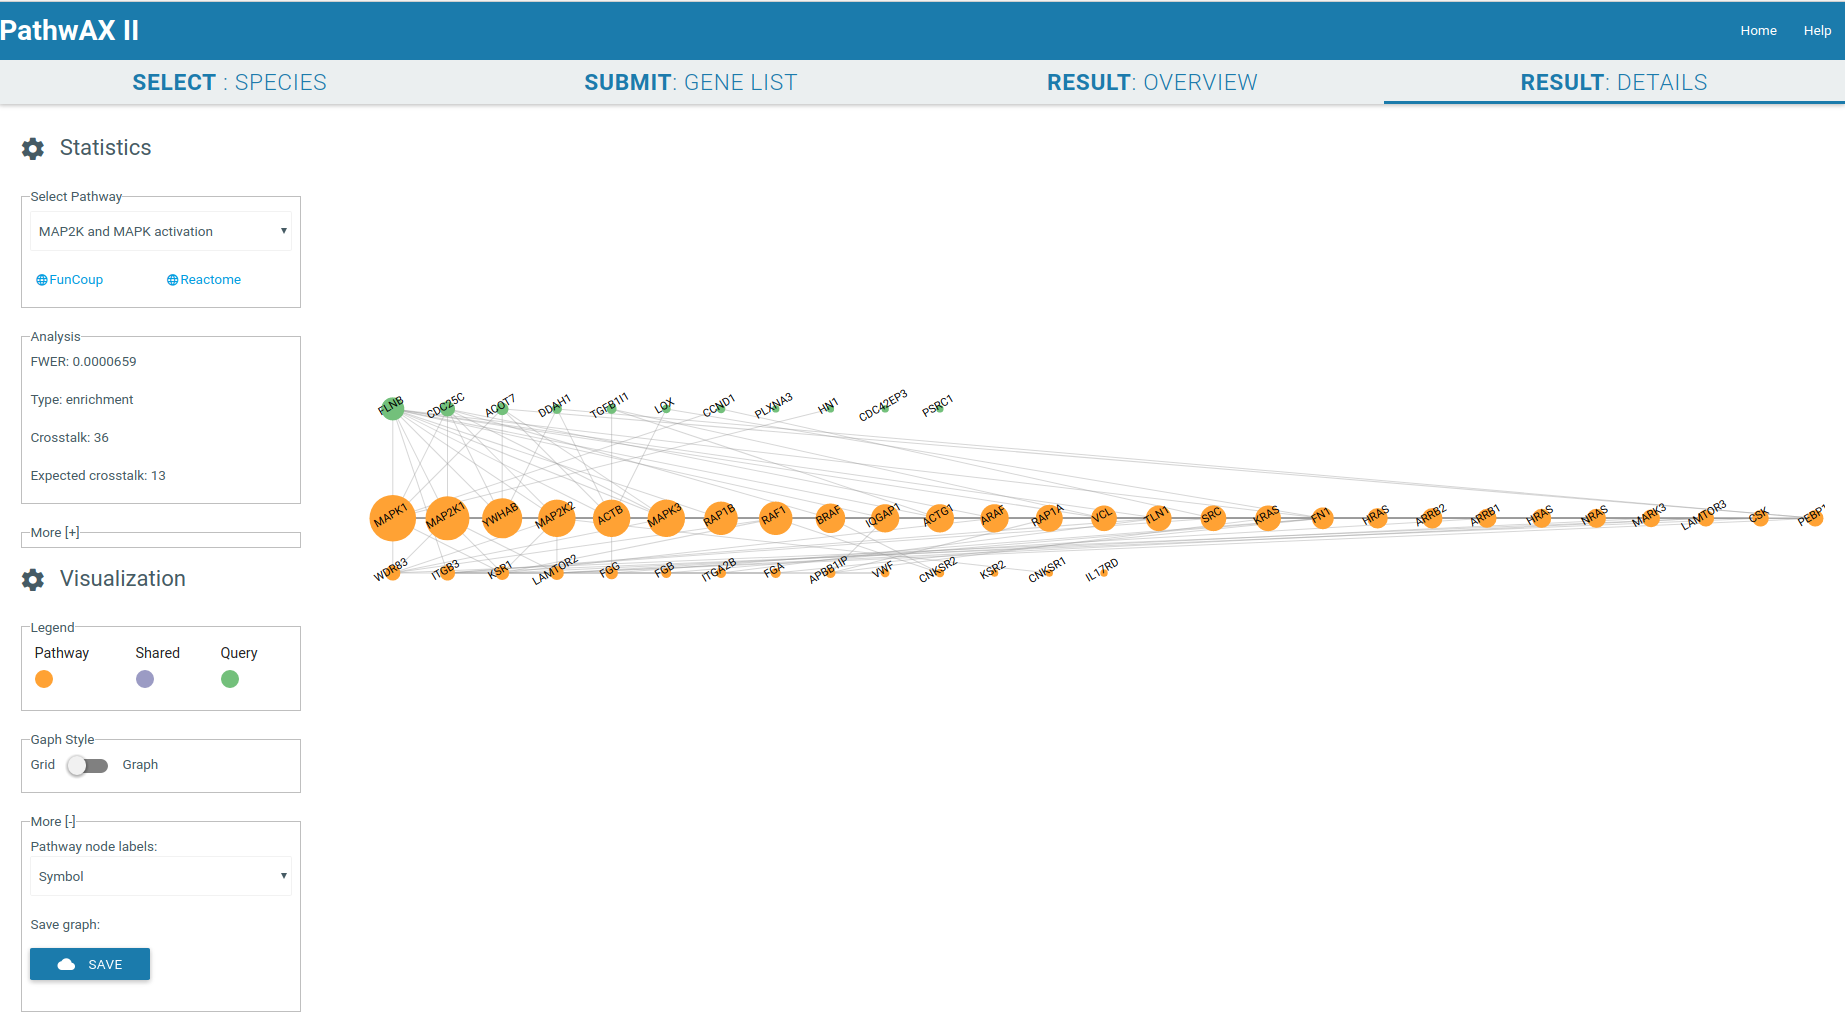
-
Networks
Species Genes Links Pathways KEGG v94.1 Pathways Reactome v72 Unique pathway genes in KEGG v94.1 Unique pathway genes in Reactome v72 Homo sapiens 12 051 1 222 749 327 289 7 679 7 894 Mus musculus 12 105 1 309 394 323 210 8 185 6 485 Rattus norvegicus 11 979 1 534 726 323 210 8 162 6 531 Canis familiaris 10 189 665 143 323 181 6 660 5 935 Gallus gallus 6 327 284 502 164 151 3 301 3 099 Danio rerio 8 723 757 523 163 190 5 860 5 017 Drosophila melanogaster 6 420 444 885 132 189 2 944 2 862 Caenorhabditis elegans 6 828 674 507 130 220 2 489 3 128 Saccharomyces cerevisiae S288c 4 901 495 380 109 68 2 027 1 063 Arabidopsis thaliana 12 035 1 465 923 131 117 5 186 3 156 Plasmodium falciparum 1 191 36 806 80 49 1 024 457 Schizosaccharomyces pombe 2 441 73 698 106 125 1 462 1 164 Oryza sativa 5 620 845 755 130 117 4 656 2 166 Bos taurus 11 988 1 167 678 323 57 6 863 2 910 Ciona intestinalis 3 783 314 715 121 − 1 588 − Escherichia coli 2 860 49 736 107 − 1 520 − Bacillus subtilis 2 680 12 573 104 − 1 231 − -
Error Messages
-
Message: "Gene Identifier Problem"
Caused by using unsupported gene IDs. PathwAX II supports Ensembl id, Gene Symbol, NCBI id, Uniprot id, FlyBase id, WormBase id, PomBase id, ZFIN id and TairLocusAccession. -
Message: "Too many query genes"
Caused by submitting a too large quene query. Query size is limited to 400 genes. -
Message: "No links found""
Caused if the network search did not return any links at all. -
Message: "No pathways found""
Caused if PathwAX did not find any connections between the query and the pathway database.
-
Message: "Gene Identifier Problem"
-
Contact
Please do not hesitate to contact us for feedback, questions, and suggestions.
E-Mail: miguel.castresana@scilifelab.se
If you want to report any problems or errors, please consider including the following information:
- the browser you are using
- the query
- a screenshot showing the problem